


Trusted by over 15 Million Traders
The Most Awarded Broker
for a Reason
Easy Access to 1,400+ Global Assets
EURUSD
Euro vs U.S. Dollar
US500
S&P 500 (US500)
GOLD
Gold
COFFEE
US Coffee
Apple
Apple (AAPL.OQ)
-

Finance Magnates 颁发
-

Finance Magnates 颁发
-

Capital Finance International Magazine (CFI.co) 2024年颁赠
-

COLWMA 2024年颁赠
-

荣获World Finance Forex Awards 2023最佳外汇客户服务奖
-

荣获World Finance Forex Awards 2023欧洲最佳外汇经纪商奖
-

荣获World Finance Forex Awards 2023澳大拉西亚最佳外汇经纪商奖
-

荣获World Finance Forex Awards 2023拉丁美洲最佳外汇经纪商奖
-

荣获World Finance Forex Awards 2023中东最佳外汇经纪商奖
-

CFI.co于2023年颁赠
-

荣获2023年City of London Wealth Management Awards
-

荣获2022年埃及金融博览会颁赠
-

荣获2022年City of London Wealth Management Awards
-

CFI.co于2022年颁赠
-

荣获Global Forex Awards 2022 — 零售外汇 颁赠
-
2021年迪拜外汇博览会获颁赠
-

Ultimate Fintech 2021年颁赠
-

荣获2021年City of London Wealth Management Awards
-

FX168于2020年12月颁赠
-

荣获Global Business Awards 2020
-

荣获2020年City of London Wealth Management Awards
-

Capital Finance International Magazine (CFI.co)颁赠
-

Capital Finance International Magazine (CFI.co)颁赠
-

荣获2019年City of London Wealth Management Awards
-

Shares Magazine 授予 UK Forex Awards 2018
-

Capital Finance International Magazine (CFI.co)颁赠
-

Capital Finance International Magazine (CFI.co)颁赠
-

2017年伦敦财富管理奖
-

2016最佳本土 客户服务
-

中东和北非地区(MENA)增长最快的经纪商
-
2015年最佳外汇科技提供商
-
2014年最佳外汇科技提供商
-

2014年最佳外汇科技提供商
-

荣获 The Trading Show 2024年非洲 Africa Fintech 峰会颁赠
-

荣获2024年中东地区 Brokersview 颁赠
-
荣获2024年中东地区 Brokersview 颁赠
-

荣获2024年阿曼 Smart Vision 峰会颁赠
-

荣获2024年迪拜外汇博览会颁赠
-

荣获2024年迪拜 Forex Traders Summit 颁赠
-

2024年埃及 Smart Vision 峰会颁赠
-

投查查于2024年颁赠
-

Capital Finance International Magazine (CFI.co) 2024年颁赠
-

CFI.co于2023年颁赠
-

CFI.co于2023年颁赠
-

交易社区平台FOLLOWME于2022年颁赠
-
2022年迪拜Forex Expo获颁赠
-
2022年迪拜Forex Expo获颁赠
-

荣获Global Forex Awards 2022 — 零售外汇 颁赠
-

CFI.co于2022年颁赠
-

CFI.co于2022年颁赠
-

World Finance Forex Awards 2022 颁发
-

World Finance Forex Awards 2022 颁发
-

World Finance Forex Awards 2022 颁发
-

World Finance Forex Awards 2022 颁发
-
交易社区平台FOLLOWME于2021年颁赠
-

2021年埃及Smart Vision Investment Expo博览会获颁赠
-

CFI.co于2021年颁赠
-

CFI.co于2021年颁赠
-

荣获Global Forex Awards 2021 — 零售外汇 颁赠
-

荣获Global Forex Awards 2021 — 零售外汇 颁赠
-

World Finance 2021颁发
-

World Finance 2021颁发
-
FOLLOWME于2021年颁赠
-

Global Forex Awards 2021 — B2B 颁赠
-

Global Forex Awards颁赠
-

Global Forex Awards颁赠
-

CFI.co于2020年颁赠
-

CFI.co于2020年颁赠
-

荣获Global Business Awards 2020
-

World Finance Magazine 颁赠
World Finance Forex Awards 2020 -

World Finance Magazine 颁赠
World Finance Forex Awards 2020 -
FOLLOWME交易社区授予
-

Global Forex Awards颁赠
-

Global Forex Awards颁赠
-

FinTech Age Awards颁发
-

World Finance Magazine 颁赠
World Finance Forex Awards 2019 -

World Finance Magazine 颁赠
World Finance Forex Awards 2019 -

荣获 World Finance Forex Awards 2018 颁赠
-

荣获2018年埃及金融博览会颁赠
-

荣获 Shares Magazine 的 UK Forex Awards 2017 颁赠
-

荣获 World Finance Forex Awards 2017
-

2016年最佳黄金经纪商
-

2016年最佳外汇经纪商
-

2015年最佳本地客户服务
-

Global Brands Magazine 颁赠
-

Online Money Awards 2022 颁发
-

荣获2022年埃及金融博览会颁赠
-

2015最佳外汇交易平台
-

2015最佳金融交易平台
-

2013最佳创新外汇平台奖
-

2020年 Cyprus HR Awards 颁赠
-

金融行业的佼佼者
-

认证最优金牌级别
-

2014年首届亚军
-
Finance Magnates 颁发
-
Finance Magnates 颁发
-
Capital Finance International Magazine (CFI.co) 2024年颁赠
-
COLWMA 2024年颁赠
-
荣获World Finance Forex Awards 2023最佳外汇客户服务奖
-
荣获World Finance Forex Awards 2023欧洲最佳外汇经纪商奖
-
荣获World Finance Forex Awards 2023澳大拉西亚最佳外汇经纪商奖
-
荣获World Finance Forex Awards 2023拉丁美洲最佳外汇经纪商奖
-
荣获World Finance Forex Awards 2023中东最佳外汇经纪商奖
-
CFI.co于2023年颁赠
-
荣获2023年City of London Wealth Management Awards
-
荣获2022年埃及金融博览会颁赠
-
荣获2022年City of London Wealth Management Awards
-
CFI.co于2022年颁赠
-
荣获Global Forex Awards 2022 — 零售外汇 颁赠
-
2021年迪拜外汇博览会获颁赠
-
Ultimate Fintech 2021年颁赠
-
荣获2021年City of London Wealth Management Awards
-
FX168于2020年12月颁赠
-
荣获Global Business Awards 2020
-
荣获2020年City of London Wealth Management Awards
-
Capital Finance International Magazine (CFI.co)颁赠
-
Capital Finance International Magazine (CFI.co)颁赠
-
荣获2019年City of London Wealth Management Awards
-
Shares Magazine 授予 UK Forex Awards 2018
-
Capital Finance International Magazine (CFI.co)颁赠
-
Capital Finance International Magazine (CFI.co)颁赠
-
2017年伦敦财富管理奖
-
2016最佳本土 客户服务
-
中东和北非地区(MENA)增长最快的经纪商
-
2015年最佳外汇科技提供商
-
2014年最佳外汇科技提供商
-
2014年最佳外汇科技提供商
-
荣获 The Trading Show 2024年非洲 Africa Fintech 峰会颁赠
-
荣获2024年中东地区 Brokersview 颁赠
-
荣获2024年中东地区 Brokersview 颁赠
-
荣获2024年阿曼 Smart Vision 峰会颁赠
-
荣获2024年迪拜外汇博览会颁赠
-
荣获2024年迪拜 Forex Traders Summit 颁赠
-
2024年埃及 Smart Vision 峰会颁赠
-
投查查于2024年颁赠
-
Capital Finance International Magazine (CFI.co) 2024年颁赠
-
CFI.co于2023年颁赠
-
CFI.co于2023年颁赠
-
交易社区平台FOLLOWME于2022年颁赠
-
2022年迪拜Forex Expo获颁赠
-
2022年迪拜Forex Expo获颁赠
-
荣获Global Forex Awards 2022 — 零售外汇 颁赠
-
CFI.co于2022年颁赠
-
CFI.co于2022年颁赠
-
World Finance Forex Awards 2022 颁发
-
World Finance Forex Awards 2022 颁发
-
World Finance Forex Awards 2022 颁发
-
World Finance Forex Awards 2022 颁发
-
交易社区平台FOLLOWME于2021年颁赠
-
2021年埃及Smart Vision Investment Expo博览会获颁赠
-
CFI.co于2021年颁赠
-
CFI.co于2021年颁赠
-
荣获Global Forex Awards 2021 — 零售外汇 颁赠
-
荣获Global Forex Awards 2021 — 零售外汇 颁赠
-
World Finance 2021颁发
-
World Finance 2021颁发
-
FOLLOWME于2021年颁赠
-
Global Forex Awards 2021 — B2B 颁赠
-
Global Forex Awards颁赠
-
Global Forex Awards颁赠
-
CFI.co于2020年颁赠
-
CFI.co于2020年颁赠
-
荣获Global Business Awards 2020
-
World Finance Magazine 颁赠
World Finance Forex Awards 2020 -
World Finance Magazine 颁赠
World Finance Forex Awards 2020 -
FOLLOWME交易社区授予
-
Global Forex Awards颁赠
-
Global Forex Awards颁赠
-
FinTech Age Awards颁发
-
World Finance Magazine 颁赠
World Finance Forex Awards 2019 -
World Finance Magazine 颁赠
World Finance Forex Awards 2019 -
荣获 World Finance Forex Awards 2018 颁赠
-
荣获2018年埃及金融博览会颁赠
-
荣获 Shares Magazine 的 UK Forex Awards 2017 颁赠
-
荣获 World Finance Forex Awards 2017
-
2016年最佳黄金经纪商
-
2016年最佳外汇经纪商
-
2015年最佳本地客户服务
-
Global Brands Magazine 颁赠
-
Online Money Awards 2022 颁发
-
荣获2022年埃及金融博览会颁赠
-
2015最佳外汇交易平台
-
2015最佳金融交易平台
-
2013最佳创新外汇平台奖
-
2020年 Cyprus HR Awards 颁赠
-
金融行业的佼佼者
-
认证最优金牌级别
-
2014年首届亚军

Awarded BestBrokerYear After Year
CATEGORIES
News
- The "life and death line" of the US dollar index is in a hurry! 97.77 Defence Li
- If the US dollar cannot hold on with the Canadian dollar, it will fall? US CPI a
- The Bank of China, the United States and Japan will hit next week!
- A collection of positive and negative news that affects the foreign exchange mar
- European and American central banks, "to go against each other", the euro rises
market news
Technical overbought is approaching, gold and silver try to go short
Wonderful introduction:
Optimism is the line of egrets that go straight up to the sky, optimism is the thousands of white sails on the side of the sunken boat, optimism is the luxuriant grass blowing in the wind at the head of Parrot Island, optimism is the little bits of falling red that turn into spring mud to protect the flowers.
Hello everyone, today XM Foreign Exchange will bring you "[XM Foreign Exchange Platform]: Technical overbought is approaching the node, gold and silver try to go short". Hope this helps you! The original content is as follows:

Yesterday, the gold market opened at 4111.1 in early trading and the market first rose to reach 4180.2 and then fell back. The daily line reached the lowest position of 4089.8 and then the market rose again. After the daily line finally closed at 4140, the daily line closed in a spindle-like shape with an upper shadow line longer than the lower shadow line. After this form ends, the longs of 3325 and 3322 below, the longs of 3368-3370 last week, the longs of 3377 and 3385, and the longs of 3563 will be reduced and the stop loss will be followed up at 3750. Today, the first pull up will give 4180 short stop loss 4186. The lower targets are 4140, 4120 and 4100.
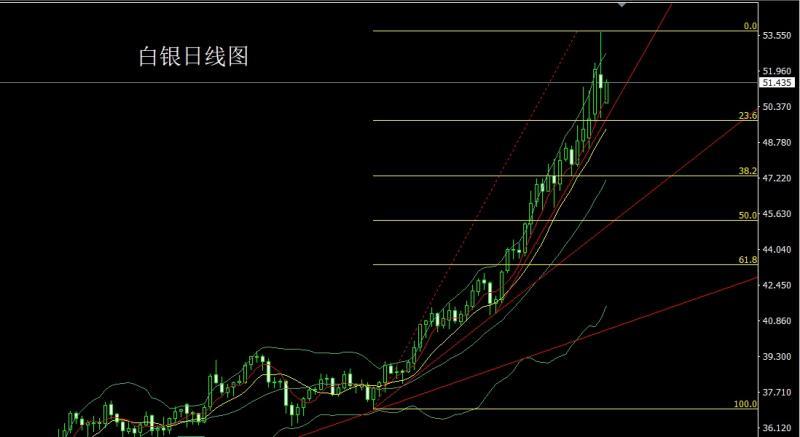
The silver market opened low at 51.804 in early trading yesterday, and then the market first rose to a position of 53.674, and then fell back under pressure. The daily line reached the lowest position of 49.875, and then the market rose in late trading. After the daily line finally closed at 51.5, the daily line has an upper and lower shadow line of equal length. The spindle shape closes, and after the close of this shape, the long position of 37.8, the long of 38.8, and the long of 44.6 are reduced and the stop loss is followed up at 47. After opening low today, the pull up gives a short stop loss of 52.75 and a stop loss of 53. The lower targets are 50.5 and 50 and 49.8 and 49.5.

European and American markets opened at 1.15656 yesterday, and then the market first rose to reach 1.15930, and then the European market quickly fell back. The daily minimum reached 115410, and then the market rose strongly. The daily maximum touched 1.16151, and then the market consolidated. The daily line finally closed at 1.16151. After reaching the position of 1.16071, the daily line closes with a big positive line with a long lower shadow. After this form ends, the daily line builds a box consolidation range. In terms of points, today's 1.15600 is more than 1.15600, the stop loss is 1.15400, and the target is 1.16000 and 1.16200-1.16400.
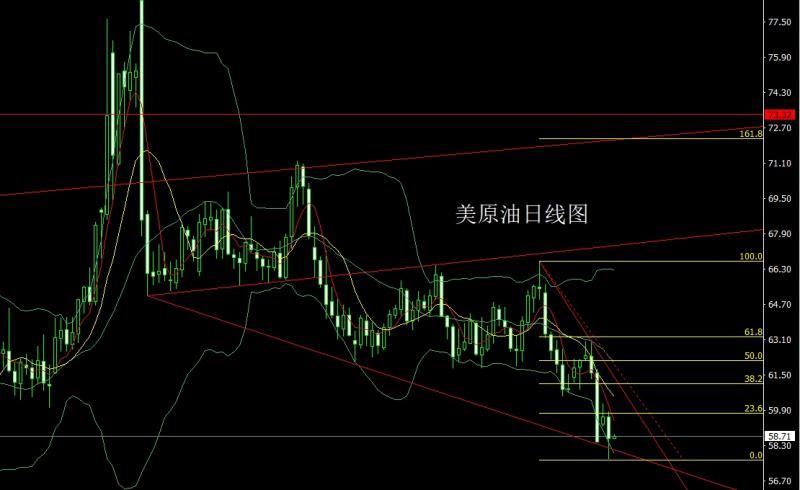
The U.S. crude oil market opened at 59.62 yesterday and then the market rose slightly to reach the position of 59.84. Then the market fluctuated strongly and fell back. The daily low reached the position of 57.69 and then the market rose in late trading. The daily line finally After closing at 58.62, the daily line closed with a big negative line with a long lower shadow. After finishing in this form, the short stop loss was 59.8 at 59.35 today, and the target cards were 58.6, 58, and 57.7.
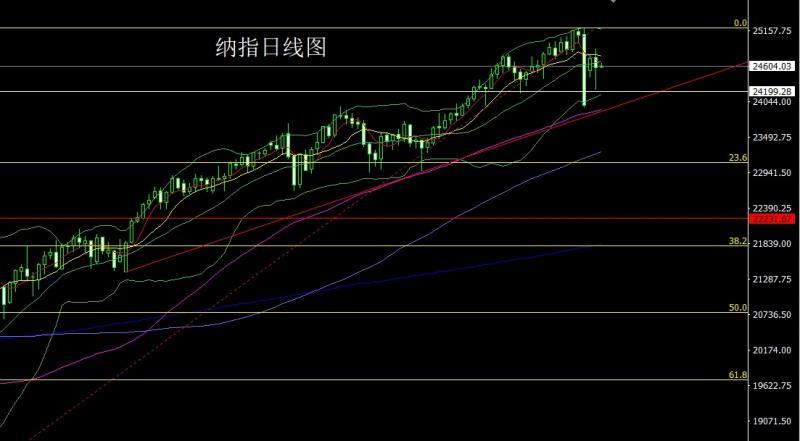
After the Nasdaq opened at 24734.19 yesterday, the market first rose to reach a daily high of 24866.96, and then fell back strongly. The daily low reached a position of 24239, and then the market rose in late trading. The daily line finally closed at 24570.17, and then the market had a lower shadow line longer than the upper shadow line. The hammer-like pattern closed, and after this pattern ended, today's stop loss was 24290 over 24350, with targets at 24650, 24750, and 24800
Fundamentals. Yesterday's fundamentals focused on the Fed's speech. Fed Chairman Powell said that the liquidity of the money market is gradually tightening, and the balance sheet reduction may be nearing www.xmmen.completion in the next few months. Recent economic activity data have been stronger than expected, but they have not yet translated into a pick-up in hiring, and the job market has declined. Banking risks have increased. Cutting interest rates too slowly may suppress employment, while cutting interest rates too quickly may cause the anti-inflation task to be abandoned halfway. Amid the government shutdown, it is believed that there will still be enough information for reference in the interest rate discussion at the end of this month, but there is concern that October data will begin to be missed. In the context of the US government shutdown, the US President will announce on Friday a list of projects supported by the Democratic Party to be closed due to the shutdown issue. The gold market's rapid fall after hitting a new high yesterday means that the technical overbought process supported by the fundamentals of the market is facing the stage of profit-taking. Today's fundamentals focus on China's September CPI annual rate at 9:30 am, which is expected to be -0.1% this round. In the evening, watch the U.S. New York Fed Manufacturing Index for October at 20:30. Tomorrow morning, focus on the Federal Reserve’s Beige Book of Economic Conditions released at 2:00 am.
In operation, gold: belowThe longs of 3325 and 3322 and the longs of 3368-3370 last week are 3377 and 3385 longs and the longs of 3563. After reducing the position, the stop loss is followed up and held at 3750. Today, the first pull up gives 4180 short stop loss 4186. The lower targets are 4140, 4120 and 4100.
Silver: The bottom is 37.8 long, 38.8 long and 44.6 long. After reducing the position, the stop loss is followed up and held at 47. After opening low today, it pulls up and gives 52.75. Short stop loss is 53. The bottom target is 50.5 and 50 and 49.8 and 49.5.
Europe and the United States: 1.156 today 00 long stop loss 1.15400, target 1.16000 and 1.16200-1.16400.
U.S. crude oil: short stop loss 59.8 at 59.35 today, target card 58.6, 58 and 57.7.
Nasdaq: stop long 24350 today Loss 24290, target 24650, 24750 and 24800
The above content is all about "[XM Foreign Exchange Platform]: Technical overbought is approaching the node, gold and silver try to go short". It was carefully www.xmmen.compiled and edited by the editor of XM Foreign Exchange. I hope it will be helpful to your trading! Thanks for the support!
Sharing is as simple as a gust of wind can bring refreshing, as pure as a flower can bring fragrance. Gradually my dusty heart opened up, and I understood that sharing is actually as simple as the technology.
Disclaimers: XM Group only provides execution services and access permissions for online trading platforms, and allows individuals to view and/or use the website or the content provided on the website, but has no intention of making any changes or extensions, nor will it change or extend its services and access permissions. All access and usage permissions will be subject to the following terms and conditions: (i) Terms and conditions; (ii) Risk warning; And (iii) a complete disclaimer. Please note that all information provided on the website is for general informational purposes only. In addition, the content of all XM online trading platforms does not constitute, and cannot be used for any unauthorized financial market trading invitations and/or invitations. Financial market transactions pose significant risks to your investment capital.
All materials published on online trading platforms are only intended for educational/informational purposes and do not include or should be considered for financial, investment tax, or trading related consulting and advice, or transaction price records, or any financial product or non invitation related trading offers or invitations.
All content provided by XM and third-party suppliers on this website, including opinions, news, research, analysis, prices, other information, and third-party website links, remains unchanged and is provided as general market commentary rather than investment advice. All materials published on online trading platforms are only for educational/informational purposes and do not include or should be considered as applicable to financial, investment tax, or trading related advice and recommendations, or transaction price records, or any financial product or non invitation related financial offers or invitations. Please ensure that you have read and fully understood the information on XM's non independent investment research tips and risk warnings. For more details, please click here