


Trusted by over 15 Million Traders
The Most Awarded Broker
for a Reason
Easy Access to 1,400+ Global Assets
EURUSD
Euro vs U.S. Dollar
US500
S&P 500 (US500)
GOLD
Gold
COFFEE
US Coffee
Apple
Apple (AAPL.OQ)
-

Finance Magnates 颁发
-

Finance Magnates 颁发
-

Capital Finance International Magazine (CFI.co) 2024年颁赠
-

COLWMA 2024年颁赠
-

荣获World Finance Forex Awards 2023最佳外汇客户服务奖
-

荣获World Finance Forex Awards 2023欧洲最佳外汇经纪商奖
-

荣获World Finance Forex Awards 2023澳大拉西亚最佳外汇经纪商奖
-

荣获World Finance Forex Awards 2023拉丁美洲最佳外汇经纪商奖
-

荣获World Finance Forex Awards 2023中东最佳外汇经纪商奖
-

CFI.co于2023年颁赠
-

荣获2023年City of London Wealth Management Awards
-

荣获2022年埃及金融博览会颁赠
-

荣获2022年City of London Wealth Management Awards
-

CFI.co于2022年颁赠
-

荣获Global Forex Awards 2022 — 零售外汇 颁赠
-
2021年迪拜外汇博览会获颁赠
-

Ultimate Fintech 2021年颁赠
-

荣获2021年City of London Wealth Management Awards
-

FX168于2020年12月颁赠
-

荣获Global Business Awards 2020
-

荣获2020年City of London Wealth Management Awards
-

Capital Finance International Magazine (CFI.co)颁赠
-

Capital Finance International Magazine (CFI.co)颁赠
-

荣获2019年City of London Wealth Management Awards
-

Shares Magazine 授予 UK Forex Awards 2018
-

Capital Finance International Magazine (CFI.co)颁赠
-

Capital Finance International Magazine (CFI.co)颁赠
-

2017年伦敦财富管理奖
-

2016最佳本土 客户服务
-

中东和北非地区(MENA)增长最快的经纪商
-
2015年最佳外汇科技提供商
-
2014年最佳外汇科技提供商
-

2014年最佳外汇科技提供商
-

荣获 The Trading Show 2024年非洲 Africa Fintech 峰会颁赠
-

荣获2024年中东地区 Brokersview 颁赠
-
荣获2024年中东地区 Brokersview 颁赠
-

荣获2024年阿曼 Smart Vision 峰会颁赠
-

荣获2024年迪拜外汇博览会颁赠
-

荣获2024年迪拜 Forex Traders Summit 颁赠
-

2024年埃及 Smart Vision 峰会颁赠
-

投查查于2024年颁赠
-

Capital Finance International Magazine (CFI.co) 2024年颁赠
-

CFI.co于2023年颁赠
-

CFI.co于2023年颁赠
-

交易社区平台FOLLOWME于2022年颁赠
-
2022年迪拜Forex Expo获颁赠
-
2022年迪拜Forex Expo获颁赠
-

荣获Global Forex Awards 2022 — 零售外汇 颁赠
-

CFI.co于2022年颁赠
-

CFI.co于2022年颁赠
-

World Finance Forex Awards 2022 颁发
-

World Finance Forex Awards 2022 颁发
-

World Finance Forex Awards 2022 颁发
-

World Finance Forex Awards 2022 颁发
-
交易社区平台FOLLOWME于2021年颁赠
-

2021年埃及Smart Vision Investment Expo博览会获颁赠
-

CFI.co于2021年颁赠
-

CFI.co于2021年颁赠
-

荣获Global Forex Awards 2021 — 零售外汇 颁赠
-

荣获Global Forex Awards 2021 — 零售外汇 颁赠
-

World Finance 2021颁发
-

World Finance 2021颁发
-
FOLLOWME于2021年颁赠
-

Global Forex Awards 2021 — B2B 颁赠
-

Global Forex Awards颁赠
-

Global Forex Awards颁赠
-

CFI.co于2020年颁赠
-

CFI.co于2020年颁赠
-

荣获Global Business Awards 2020
-

World Finance Magazine 颁赠
World Finance Forex Awards 2020 -

World Finance Magazine 颁赠
World Finance Forex Awards 2020 -
FOLLOWME交易社区授予
-

Global Forex Awards颁赠
-

Global Forex Awards颁赠
-

FinTech Age Awards颁发
-

World Finance Magazine 颁赠
World Finance Forex Awards 2019 -

World Finance Magazine 颁赠
World Finance Forex Awards 2019 -

荣获 World Finance Forex Awards 2018 颁赠
-

荣获2018年埃及金融博览会颁赠
-

荣获 Shares Magazine 的 UK Forex Awards 2017 颁赠
-

荣获 World Finance Forex Awards 2017
-

2016年最佳黄金经纪商
-

2016年最佳外汇经纪商
-

2015年最佳本地客户服务
-

Global Brands Magazine 颁赠
-

Online Money Awards 2022 颁发
-

荣获2022年埃及金融博览会颁赠
-

2015最佳外汇交易平台
-

2015最佳金融交易平台
-

2013最佳创新外汇平台奖
-

2020年 Cyprus HR Awards 颁赠
-

金融行业的佼佼者
-

认证最优金牌级别
-

2014年首届亚军
-
Finance Magnates 颁发
-
Finance Magnates 颁发
-
Capital Finance International Magazine (CFI.co) 2024年颁赠
-
COLWMA 2024年颁赠
-
荣获World Finance Forex Awards 2023最佳外汇客户服务奖
-
荣获World Finance Forex Awards 2023欧洲最佳外汇经纪商奖
-
荣获World Finance Forex Awards 2023澳大拉西亚最佳外汇经纪商奖
-
荣获World Finance Forex Awards 2023拉丁美洲最佳外汇经纪商奖
-
荣获World Finance Forex Awards 2023中东最佳外汇经纪商奖
-
CFI.co于2023年颁赠
-
荣获2023年City of London Wealth Management Awards
-
荣获2022年埃及金融博览会颁赠
-
荣获2022年City of London Wealth Management Awards
-
CFI.co于2022年颁赠
-
荣获Global Forex Awards 2022 — 零售外汇 颁赠
-
2021年迪拜外汇博览会获颁赠
-
Ultimate Fintech 2021年颁赠
-
荣获2021年City of London Wealth Management Awards
-
FX168于2020年12月颁赠
-
荣获Global Business Awards 2020
-
荣获2020年City of London Wealth Management Awards
-
Capital Finance International Magazine (CFI.co)颁赠
-
Capital Finance International Magazine (CFI.co)颁赠
-
荣获2019年City of London Wealth Management Awards
-
Shares Magazine 授予 UK Forex Awards 2018
-
Capital Finance International Magazine (CFI.co)颁赠
-
Capital Finance International Magazine (CFI.co)颁赠
-
2017年伦敦财富管理奖
-
2016最佳本土 客户服务
-
中东和北非地区(MENA)增长最快的经纪商
-
2015年最佳外汇科技提供商
-
2014年最佳外汇科技提供商
-
2014年最佳外汇科技提供商
-
荣获 The Trading Show 2024年非洲 Africa Fintech 峰会颁赠
-
荣获2024年中东地区 Brokersview 颁赠
-
荣获2024年中东地区 Brokersview 颁赠
-
荣获2024年阿曼 Smart Vision 峰会颁赠
-
荣获2024年迪拜外汇博览会颁赠
-
荣获2024年迪拜 Forex Traders Summit 颁赠
-
2024年埃及 Smart Vision 峰会颁赠
-
投查查于2024年颁赠
-
Capital Finance International Magazine (CFI.co) 2024年颁赠
-
CFI.co于2023年颁赠
-
CFI.co于2023年颁赠
-
交易社区平台FOLLOWME于2022年颁赠
-
2022年迪拜Forex Expo获颁赠
-
2022年迪拜Forex Expo获颁赠
-
荣获Global Forex Awards 2022 — 零售外汇 颁赠
-
CFI.co于2022年颁赠
-
CFI.co于2022年颁赠
-
World Finance Forex Awards 2022 颁发
-
World Finance Forex Awards 2022 颁发
-
World Finance Forex Awards 2022 颁发
-
World Finance Forex Awards 2022 颁发
-
交易社区平台FOLLOWME于2021年颁赠
-
2021年埃及Smart Vision Investment Expo博览会获颁赠
-
CFI.co于2021年颁赠
-
CFI.co于2021年颁赠
-
荣获Global Forex Awards 2021 — 零售外汇 颁赠
-
荣获Global Forex Awards 2021 — 零售外汇 颁赠
-
World Finance 2021颁发
-
World Finance 2021颁发
-
FOLLOWME于2021年颁赠
-
Global Forex Awards 2021 — B2B 颁赠
-
Global Forex Awards颁赠
-
Global Forex Awards颁赠
-
CFI.co于2020年颁赠
-
CFI.co于2020年颁赠
-
荣获Global Business Awards 2020
-
World Finance Magazine 颁赠
World Finance Forex Awards 2020 -
World Finance Magazine 颁赠
World Finance Forex Awards 2020 -
FOLLOWME交易社区授予
-
Global Forex Awards颁赠
-
Global Forex Awards颁赠
-
FinTech Age Awards颁发
-
World Finance Magazine 颁赠
World Finance Forex Awards 2019 -
World Finance Magazine 颁赠
World Finance Forex Awards 2019 -
荣获 World Finance Forex Awards 2018 颁赠
-
荣获2018年埃及金融博览会颁赠
-
荣获 Shares Magazine 的 UK Forex Awards 2017 颁赠
-
荣获 World Finance Forex Awards 2017
-
2016年最佳黄金经纪商
-
2016年最佳外汇经纪商
-
2015年最佳本地客户服务
-
Global Brands Magazine 颁赠
-
Online Money Awards 2022 颁发
-
荣获2022年埃及金融博览会颁赠
-
2015最佳外汇交易平台
-
2015最佳金融交易平台
-
2013最佳创新外汇平台奖
-
2020年 Cyprus HR Awards 颁赠
-
金融行业的佼佼者
-
认证最优金牌级别
-
2014年首届亚军

Awarded BestBrokerYear After Year
CATEGORIES
News
- Gold is about to hit a new high!
- Germany's inflation pushed up the euro beyond expectations, EUR/JPY rose to 172.
- Trump's tariffs are approaching, and US crude oil stops falling and rises hidden
- Gold long started a good start this week, and gold long won seven consecutive vi
- The darkest moment in the euro zone! Markets short the euro, betting on historic
market news
Gold 3350 is a short-term watershed, with European and American daily lines and four-hour resistance resonant
Wonderful Introduction:
If the sea loses the rolling waves, it will lose its majesty; if the desert loses the dancing of flying sand, it will lose its magnificence; if life loses its real journey, it will lose its meaning.
Hello everyone, today XM Foreign Exchange will bring you "[XM Group]: Gold 3350 is a short-term watershed, with European and American daily lines and four-hour resistance resonance". Hope it will be helpful to you! The original content is as follows:
Dollar Index
In terms of the performance of the US dollar index, the US dollar index showed an upward trend on Monday. The price of the US dollar index rose to 98.81 on the day, and fell to 97.529 at the lowest, and finally closed at 97.697. Looking back on the market performance last Friday, during the early trading session, the price rose in the short term at the low point of the retreat in the early morning of the previous day, and then hit a high point of the day and was under pressure again. After the opening of the European session, the price continued to be suppressed, and the US session was affected by Powell's speech and prices fell rapidly and finally closed at a low level.
From a multi-cycle analysis, the weekly level has recently been supported by the weekly support up and down. This week, the focus is on the 98.10 position to stabilize. Once it stands firm, the medium-term bulls will continue to rise. At the daily level, on the daily line, gold prices are currently fluctuating at low levels, and overall, we still need to pay attention to the stable performance of the daily line 98.10. From the four-hour perspective, the four-hour trend is the key to our long-term price trend. Currently, the four-hour resistance is in the 98.20 area, which resonates with the daily and weekly support. This area continues to see further price increases in this area. The same bulls performed in one hour, so we will continue to pay attention to the continuation of bulls in the future.
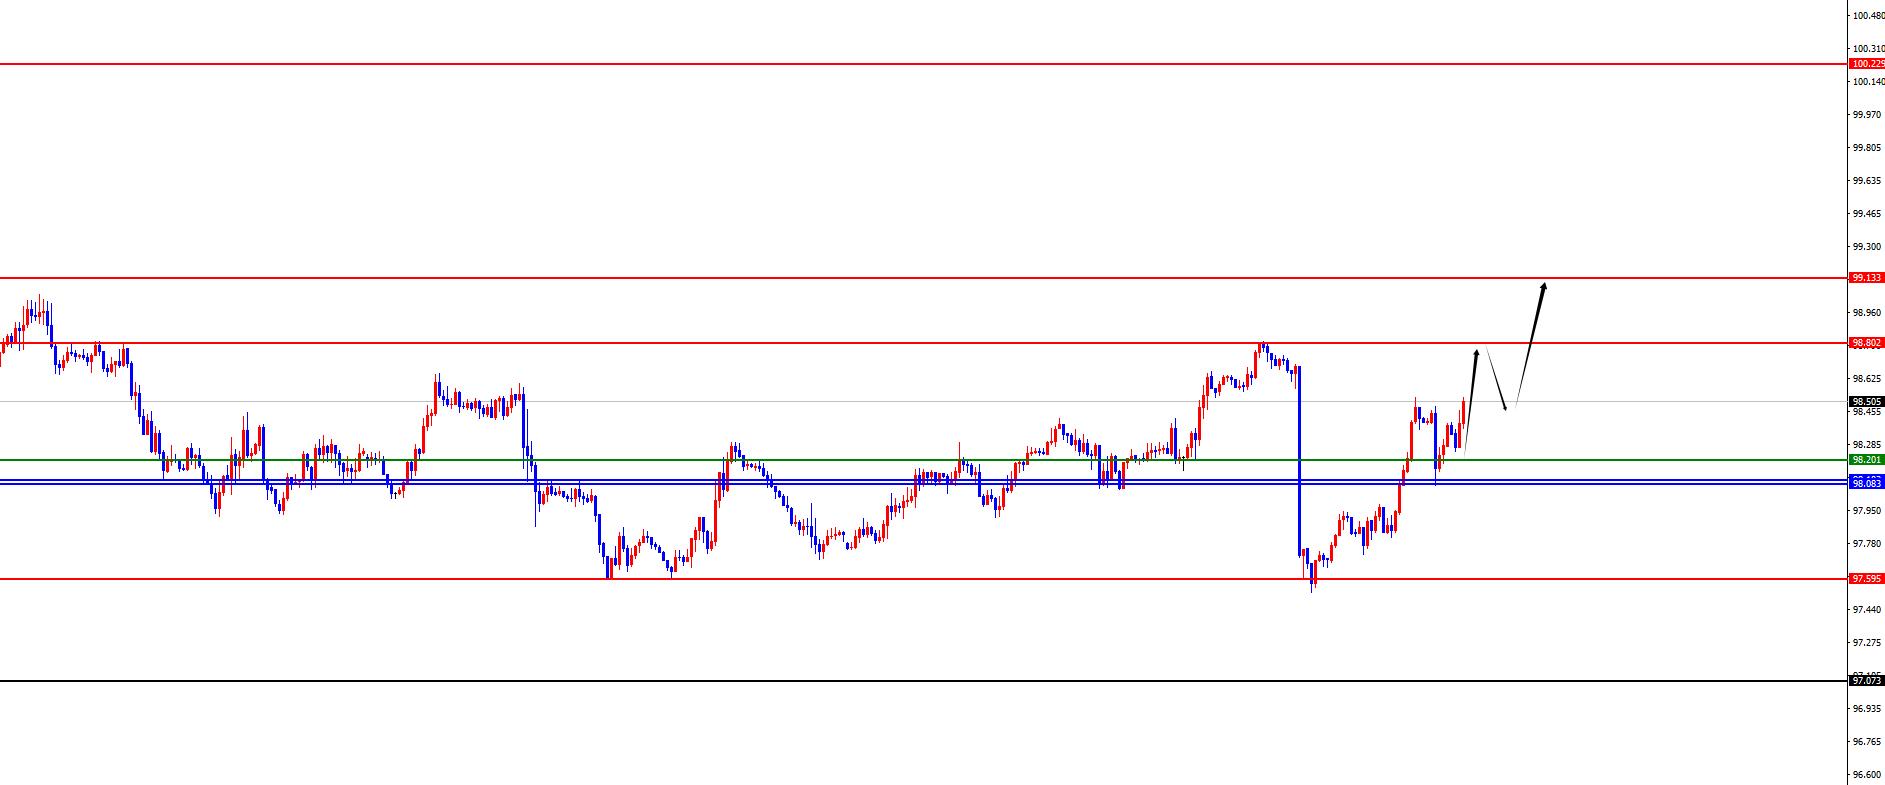
The US dollar index has a long range of 98.10-20, with a defense of 5 US dollars, and a target of 98.80-99.10
Gold
In terms of gold, the overall price of gold showed a decline on Monday, with the highest price rising to 3376.13 on the day and the lowest price fell to 3359.65 on the day.The closing price was 3365.48. In response to the pressure decline in gold prices in the early trading on Monday, the price ended with a big negative end. Today, due to the news, gold hit the high point of this week again, but overall it is still bearish, so we are temporarily paying attention to the early trading high point suppression and the upper trend line 3410 area suppression, and the 3350 position below is a long-shoulder watershed.
From multi-cycle analysis, first observe the monthly rhythm, the price has continued to fluctuate at high levels in recent months, so bulls need to be cautious before breaking through the previous high. Currently, the long and short watershed of the monthly line is at 2920. In the short term, the gains and losses of the high and low points of the last month have become the key. From the weekly level, gold on the weekly line has continued to fluctuate at a high level recently. Currently, as time goes by, the weekly watershed is at 3350. Only after the subsequent price closes below this position will the space be truly opened. From the daily level, the daily line broke through the daily resistance due to news last Friday. The current daily line watershed is at 3350. Overall, the price is still in the triangle oscillation and contraction range. The space is gradually decreasing, and the space will be opened after the subsequent break of the contraction range. From the four-hour level, 3360 is currently the short-term key in the four-hour period, and the subsequent price will show that it will fall below 3350. Therefore, you can wait for the rebound to fall below 3350 and then rebound to short. Aggressors can short before breaking the early high point. If you accidentally break up, you will wait for the 3410 area to be short. It is also a sign of empty performance over an hour.
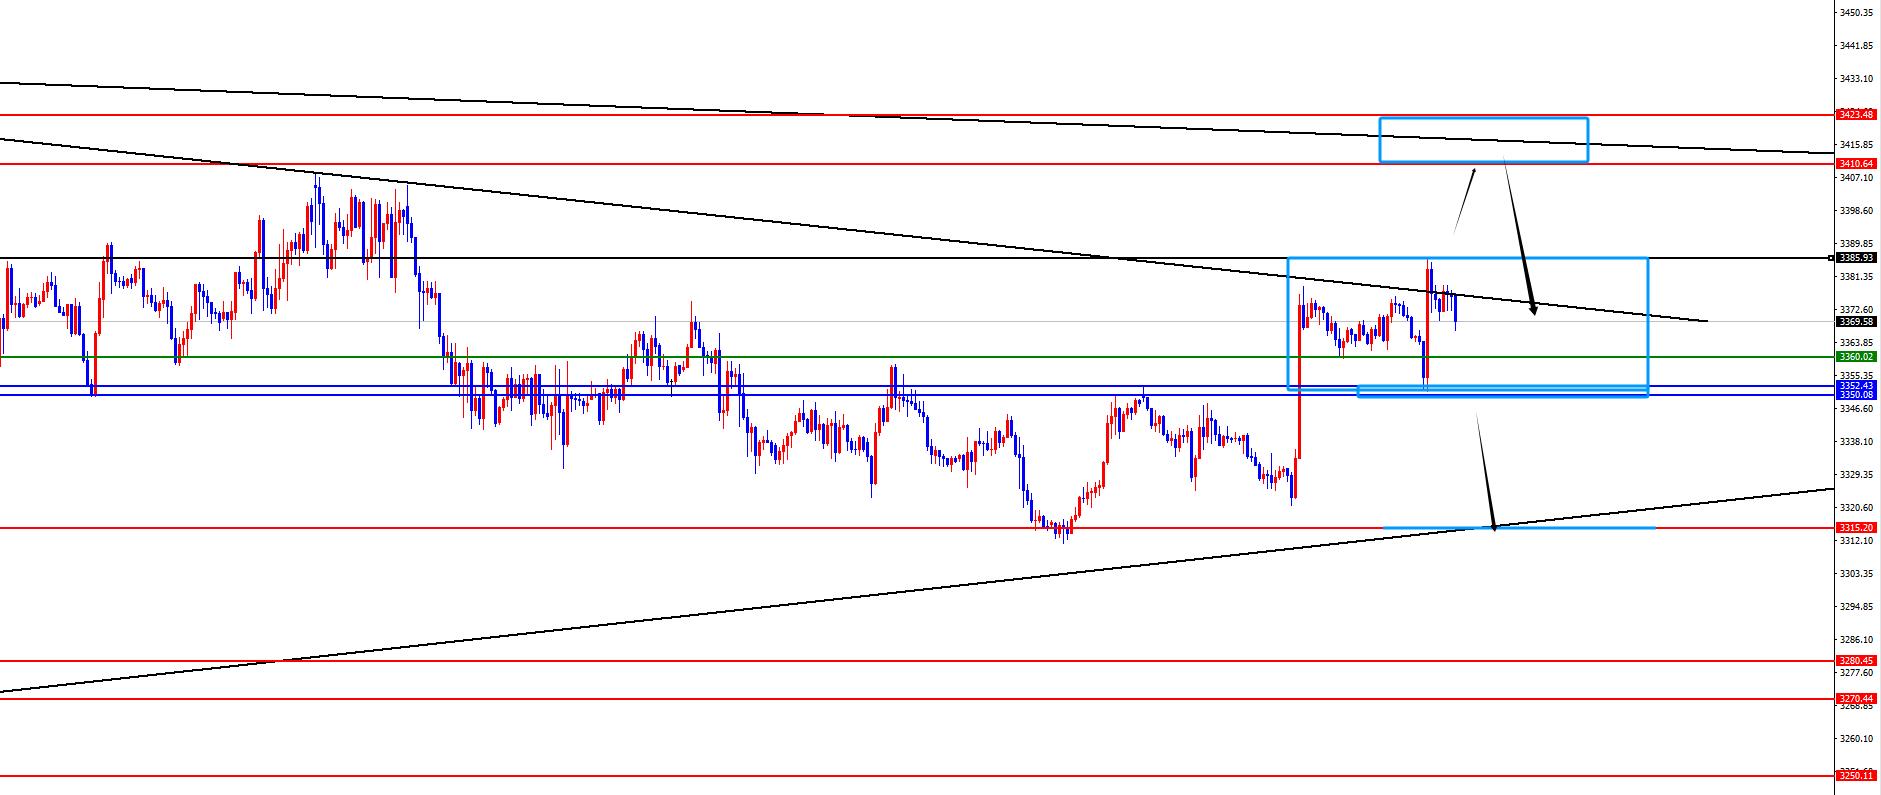
Gold 3350-3351 is a watershed. If you don’t break the early high, you will first look at the pressure. If you accidentally rise, you will pay attention to the 3410 regional suppression
Europe and the United States
Europe and the United States, the prices of European and American prices generally showed a decline on Monday. The price fell to 1.1602 at the lowest point on the day, and rose to 1.1725 at the highest point and closed at 1.1615 at the same time. Looking back at the performance of European and American markets on Monday, prices fell directly in pressure in the early trading, and then the price maintained a weak performance. The United States was under significant pressure after the trading session and touched the weekly support area, and the daily line ended in a big negative situation.
From a multi-cycle analysis, from the perspective of the monthly line level, Europe and the United States are supported at 1.0950, so long-term bulls are treated, and the monthly line ends with a large negative end. Therefore, when you are bullish, you need to pay attention to market adjustments. From the weekly level, the price is supported by the 1.1620 area, which is the long-shoulder watershed in the mid-line trend. From the daily level, as time goes by, the daily line is currently supported at 1.1660. This position is a key watershed in the band trend. Yesterday, the price breaks down, so we need to pay attention to the pressure situation at this position. After all, the gains and losses of the weekly support below are the key. According to the four-hour level, the current four-hour resistance is in the 1.1650-60 area, and the price is short-term short-term.
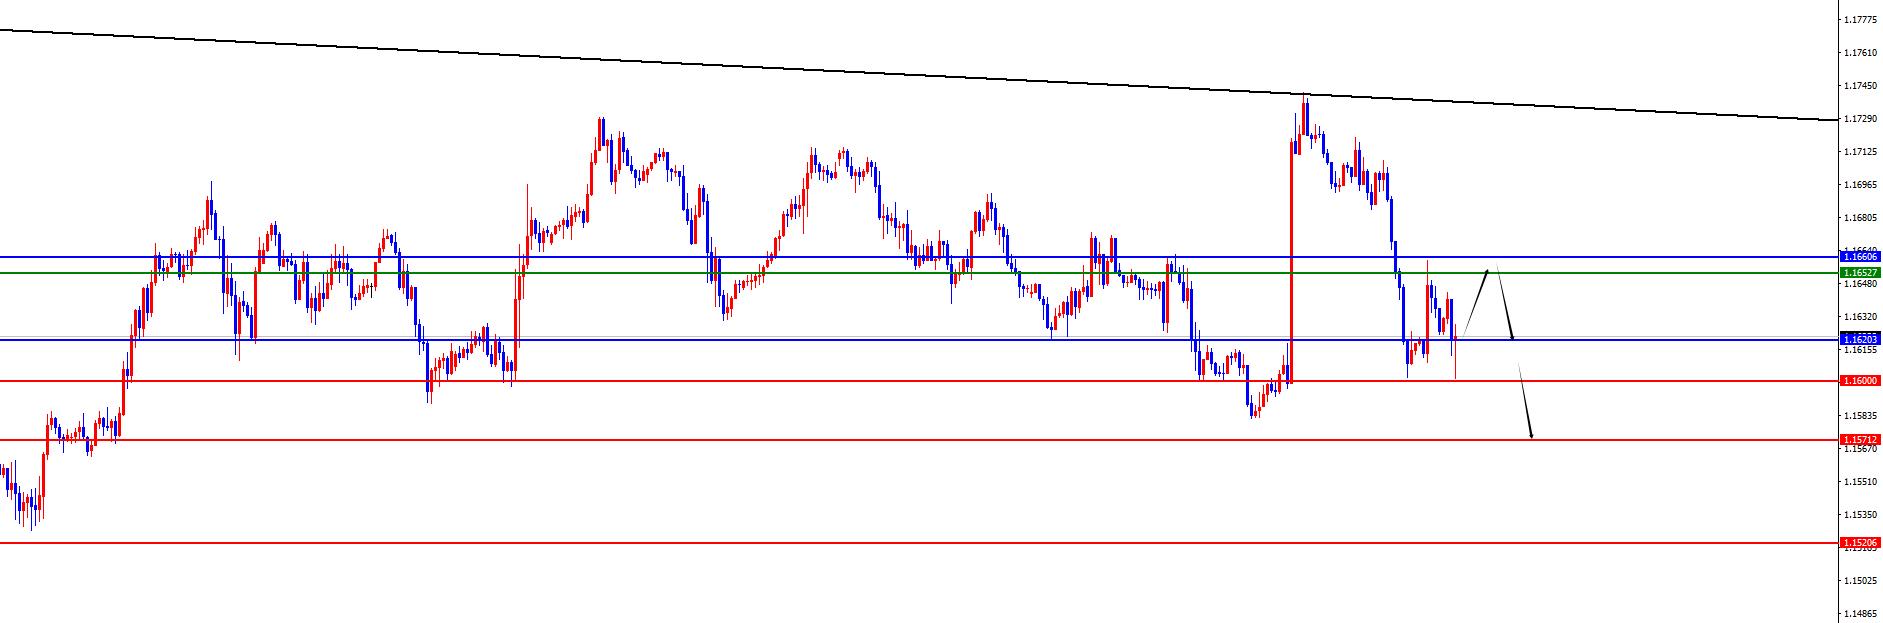
Europe and America 1.1650-1.1660 range is empty, defense is 40 points, target 1.1620-1.1570-1.1520
[Finance data and events that are focused today] Tuesday, August 26, 2025
① To be determined Domestic refined oil opens a new round of price adjustment window
②20:30 US July durable goods order monthly rate
③21:00 US June FHFA House Price Index Monthly Rate
④21:00 US June S&P/CS 20 major cities have not yet Seasonal adjustment of housing price index annual rate
⑤22:00 US August Consulting Chamber of www.xmmen.commerce Consumer Confidence Index
⑥22:00 US August Richmond Fed Manufacturing Index
⑦ Next day 02:45 Bank of Canada Governor McClum delivered a speech
⑧ Next day 04:30 US to August 22
Note: The above is only personal opinion and strategy, for reference and www.xmmen.communication only, and does not give customers any investment advice. It has nothing to do with customers' investment, and is not used as a basis for placing an order.
The above content is all about "【XM Group】: Gold 3350 is a short-term watershed, European and American daily lines and four-hour resistance resonance". It is carefully www.xmmen.compiled and edited by the editor of XM Forex. I hope it will be helpful to your trading! Thanks for the support!
Every successful person has a beginning. Only by having the courage to start can you find the way to success. Read the next article now!
Disclaimers: XM Group only provides execution services and access permissions for online trading platforms, and allows individuals to view and/or use the website or the content provided on the website, but has no intention of making any changes or extensions, nor will it change or extend its services and access permissions. All access and usage permissions will be subject to the following terms and conditions: (i) Terms and conditions; (ii) Risk warning; And (iii) a complete disclaimer. Please note that all information provided on the website is for general informational purposes only. In addition, the content of all XM online trading platforms does not constitute, and cannot be used for any unauthorized financial market trading invitations and/or invitations. Financial market transactions pose significant risks to your investment capital.
All materials published on online trading platforms are only intended for educational/informational purposes and do not include or should be considered for financial, investment tax, or trading related consulting and advice, or transaction price records, or any financial product or non invitation related trading offers or invitations.
All content provided by XM and third-party suppliers on this website, including opinions, news, research, analysis, prices, other information, and third-party website links, remains unchanged and is provided as general market commentary rather than investment advice. All materials published on online trading platforms are only for educational/informational purposes and do not include or should be considered as applicable to financial, investment tax, or trading related advice and recommendations, or transaction price records, or any financial product or non invitation related financial offers or invitations. Please ensure that you have read and fully understood the information on XM's non independent investment research tips and risk warnings. For more details, please click here