


Trusted by over 15 Million Traders
The Most Awarded Broker
for a Reason
Easy Access to 1,400+ Global Assets
EURUSD
Euro vs U.S. Dollar
US500
S&P 500 (US500)
GOLD
Gold
COFFEE
US Coffee
Apple
Apple (AAPL.OQ)
-

Finance Magnates 颁发
-

Finance Magnates 颁发
-

Capital Finance International Magazine (CFI.co) 2024年颁赠
-

COLWMA 2024年颁赠
-

荣获World Finance Forex Awards 2023最佳外汇客户服务奖
-

荣获World Finance Forex Awards 2023欧洲最佳外汇经纪商奖
-

荣获World Finance Forex Awards 2023澳大拉西亚最佳外汇经纪商奖
-

荣获World Finance Forex Awards 2023拉丁美洲最佳外汇经纪商奖
-

荣获World Finance Forex Awards 2023中东最佳外汇经纪商奖
-

CFI.co于2023年颁赠
-

荣获2023年City of London Wealth Management Awards
-

荣获2022年埃及金融博览会颁赠
-

荣获2022年City of London Wealth Management Awards
-

CFI.co于2022年颁赠
-

荣获Global Forex Awards 2022 — 零售外汇 颁赠
-
2021年迪拜外汇博览会获颁赠
-

Ultimate Fintech 2021年颁赠
-

荣获2021年City of London Wealth Management Awards
-

FX168于2020年12月颁赠
-

荣获Global Business Awards 2020
-

荣获2020年City of London Wealth Management Awards
-

Capital Finance International Magazine (CFI.co)颁赠
-

Capital Finance International Magazine (CFI.co)颁赠
-

荣获2019年City of London Wealth Management Awards
-

Shares Magazine 授予 UK Forex Awards 2018
-

Capital Finance International Magazine (CFI.co)颁赠
-

Capital Finance International Magazine (CFI.co)颁赠
-

2017年伦敦财富管理奖
-

2016最佳本土 客户服务
-

中东和北非地区(MENA)增长最快的经纪商
-
2015年最佳外汇科技提供商
-
2014年最佳外汇科技提供商
-

2014年最佳外汇科技提供商
-

荣获 The Trading Show 2024年非洲 Africa Fintech 峰会颁赠
-

荣获2024年中东地区 Brokersview 颁赠
-
荣获2024年中东地区 Brokersview 颁赠
-

荣获2024年阿曼 Smart Vision 峰会颁赠
-

荣获2024年迪拜外汇博览会颁赠
-

荣获2024年迪拜 Forex Traders Summit 颁赠
-

2024年埃及 Smart Vision 峰会颁赠
-

投查查于2024年颁赠
-

Capital Finance International Magazine (CFI.co) 2024年颁赠
-

CFI.co于2023年颁赠
-

CFI.co于2023年颁赠
-

交易社区平台FOLLOWME于2022年颁赠
-
2022年迪拜Forex Expo获颁赠
-
2022年迪拜Forex Expo获颁赠
-

荣获Global Forex Awards 2022 — 零售外汇 颁赠
-

CFI.co于2022年颁赠
-

CFI.co于2022年颁赠
-

World Finance Forex Awards 2022 颁发
-

World Finance Forex Awards 2022 颁发
-

World Finance Forex Awards 2022 颁发
-

World Finance Forex Awards 2022 颁发
-
交易社区平台FOLLOWME于2021年颁赠
-

2021年埃及Smart Vision Investment Expo博览会获颁赠
-

CFI.co于2021年颁赠
-

CFI.co于2021年颁赠
-

荣获Global Forex Awards 2021 — 零售外汇 颁赠
-

荣获Global Forex Awards 2021 — 零售外汇 颁赠
-

World Finance 2021颁发
-

World Finance 2021颁发
-
FOLLOWME于2021年颁赠
-

Global Forex Awards 2021 — B2B 颁赠
-

Global Forex Awards颁赠
-

Global Forex Awards颁赠
-

CFI.co于2020年颁赠
-

CFI.co于2020年颁赠
-

荣获Global Business Awards 2020
-

World Finance Magazine 颁赠
World Finance Forex Awards 2020 -

World Finance Magazine 颁赠
World Finance Forex Awards 2020 -
FOLLOWME交易社区授予
-

Global Forex Awards颁赠
-

Global Forex Awards颁赠
-

FinTech Age Awards颁发
-

World Finance Magazine 颁赠
World Finance Forex Awards 2019 -

World Finance Magazine 颁赠
World Finance Forex Awards 2019 -

荣获 World Finance Forex Awards 2018 颁赠
-

荣获2018年埃及金融博览会颁赠
-

荣获 Shares Magazine 的 UK Forex Awards 2017 颁赠
-

荣获 World Finance Forex Awards 2017
-

2016年最佳黄金经纪商
-

2016年最佳外汇经纪商
-

2015年最佳本地客户服务
-

Global Brands Magazine 颁赠
-

Online Money Awards 2022 颁发
-

荣获2022年埃及金融博览会颁赠
-

2015最佳外汇交易平台
-

2015最佳金融交易平台
-

2013最佳创新外汇平台奖
-

2020年 Cyprus HR Awards 颁赠
-

金融行业的佼佼者
-

认证最优金牌级别
-

2014年首届亚军
-
Finance Magnates 颁发
-
Finance Magnates 颁发
-
Capital Finance International Magazine (CFI.co) 2024年颁赠
-
COLWMA 2024年颁赠
-
荣获World Finance Forex Awards 2023最佳外汇客户服务奖
-
荣获World Finance Forex Awards 2023欧洲最佳外汇经纪商奖
-
荣获World Finance Forex Awards 2023澳大拉西亚最佳外汇经纪商奖
-
荣获World Finance Forex Awards 2023拉丁美洲最佳外汇经纪商奖
-
荣获World Finance Forex Awards 2023中东最佳外汇经纪商奖
-
CFI.co于2023年颁赠
-
荣获2023年City of London Wealth Management Awards
-
荣获2022年埃及金融博览会颁赠
-
荣获2022年City of London Wealth Management Awards
-
CFI.co于2022年颁赠
-
荣获Global Forex Awards 2022 — 零售外汇 颁赠
-
2021年迪拜外汇博览会获颁赠
-
Ultimate Fintech 2021年颁赠
-
荣获2021年City of London Wealth Management Awards
-
FX168于2020年12月颁赠
-
荣获Global Business Awards 2020
-
荣获2020年City of London Wealth Management Awards
-
Capital Finance International Magazine (CFI.co)颁赠
-
Capital Finance International Magazine (CFI.co)颁赠
-
荣获2019年City of London Wealth Management Awards
-
Shares Magazine 授予 UK Forex Awards 2018
-
Capital Finance International Magazine (CFI.co)颁赠
-
Capital Finance International Magazine (CFI.co)颁赠
-
2017年伦敦财富管理奖
-
2016最佳本土 客户服务
-
中东和北非地区(MENA)增长最快的经纪商
-
2015年最佳外汇科技提供商
-
2014年最佳外汇科技提供商
-
2014年最佳外汇科技提供商
-
荣获 The Trading Show 2024年非洲 Africa Fintech 峰会颁赠
-
荣获2024年中东地区 Brokersview 颁赠
-
荣获2024年中东地区 Brokersview 颁赠
-
荣获2024年阿曼 Smart Vision 峰会颁赠
-
荣获2024年迪拜外汇博览会颁赠
-
荣获2024年迪拜 Forex Traders Summit 颁赠
-
2024年埃及 Smart Vision 峰会颁赠
-
投查查于2024年颁赠
-
Capital Finance International Magazine (CFI.co) 2024年颁赠
-
CFI.co于2023年颁赠
-
CFI.co于2023年颁赠
-
交易社区平台FOLLOWME于2022年颁赠
-
2022年迪拜Forex Expo获颁赠
-
2022年迪拜Forex Expo获颁赠
-
荣获Global Forex Awards 2022 — 零售外汇 颁赠
-
CFI.co于2022年颁赠
-
CFI.co于2022年颁赠
-
World Finance Forex Awards 2022 颁发
-
World Finance Forex Awards 2022 颁发
-
World Finance Forex Awards 2022 颁发
-
World Finance Forex Awards 2022 颁发
-
交易社区平台FOLLOWME于2021年颁赠
-
2021年埃及Smart Vision Investment Expo博览会获颁赠
-
CFI.co于2021年颁赠
-
CFI.co于2021年颁赠
-
荣获Global Forex Awards 2021 — 零售外汇 颁赠
-
荣获Global Forex Awards 2021 — 零售外汇 颁赠
-
World Finance 2021颁发
-
World Finance 2021颁发
-
FOLLOWME于2021年颁赠
-
Global Forex Awards 2021 — B2B 颁赠
-
Global Forex Awards颁赠
-
Global Forex Awards颁赠
-
CFI.co于2020年颁赠
-
CFI.co于2020年颁赠
-
荣获Global Business Awards 2020
-
World Finance Magazine 颁赠
World Finance Forex Awards 2020 -
World Finance Magazine 颁赠
World Finance Forex Awards 2020 -
FOLLOWME交易社区授予
-
Global Forex Awards颁赠
-
Global Forex Awards颁赠
-
FinTech Age Awards颁发
-
World Finance Magazine 颁赠
World Finance Forex Awards 2019 -
World Finance Magazine 颁赠
World Finance Forex Awards 2019 -
荣获 World Finance Forex Awards 2018 颁赠
-
荣获2018年埃及金融博览会颁赠
-
荣获 Shares Magazine 的 UK Forex Awards 2017 颁赠
-
荣获 World Finance Forex Awards 2017
-
2016年最佳黄金经纪商
-
2016年最佳外汇经纪商
-
2015年最佳本地客户服务
-
Global Brands Magazine 颁赠
-
Online Money Awards 2022 颁发
-
荣获2022年埃及金融博览会颁赠
-
2015最佳外汇交易平台
-
2015最佳金融交易平台
-
2013最佳创新外汇平台奖
-
2020年 Cyprus HR Awards 颁赠
-
金融行业的佼佼者
-
认证最优金牌级别
-
2014年首届亚军

Awarded BestBrokerYear After Year
CATEGORIES
News
- Gold, about to challenge $3,500!
- Economic data helps pound, but short-term technical needs to be vigilant about p
- New Zealand Fed cut interest rates by 25 basis points, NZDUSD responds
- Guide to short-term operation of major currencies
- Will the US dollar fall below 97.60? The answer is hidden in two data
market news
Gold's rising convergence triangle has entered its end, beware of taking profit at 4255
Wonderful introduction:
You don’t have to learn to be sad in your youth. What www.xmmen.comes and goes is not worth the time. What I promised you, maybe it shouldn’t be a waste of time. Remember, the icy blue that stayed awake all night, is like the romance swallowed by purple jasmine, but the road is far away and the person has not returned. Where does the love stop?
Hello everyone, today XM Forex will bring you "[XM Foreign Exchange Market Analysis]: Gold's Rising Convergence Triangle has entered the end, beware of taking profit at 4255". Hope this helps you! The original content is as follows:
Zheng's point of view: Gold's rising convergence triangle has entered the end, beware of taking profits below 4255
Reviewing yesterday's market trends and emerging technical points:
First, gold: Yesterday, the Asian market was directly shorted and rose slowly, and the European market reached the upper trend channel and the 4218 line was under pressure, and there was a rapid dive to 4165. Low point, stabilize the hourly line and bottom out; while the entire US market is in line with the given range of 4170-4225, it has repeatedly fluctuated and consolidated;
Second, silver: yesterday it was under pressure of 53 and supported at 51, which is in line with the operation within the range;
Today's market analysis and interpretation:
First, the gold daily level: it is away from the 5 moving average, today is the third day, always be wary of rising and falling. , instantly cover to the 5 moving average, or between the 5th and the 10th, because since the unilateral pull-up of 3311, it has relied on the support of the 5 moving average to rise all the way, and only once supported the 10 moving average; when it breaks away from the 5 moving average for two or three days and keeps pulling up, it is easy to suppress a wave to correct; when it broke away from the 5 moving average on October 7th and 8th, it was not easy to blindly chase the rise, and finally there was a big cloud on the 9th. The short-term moving average has been repaired, and then stabilized and continued to move unilaterally; therefore, although the trend has been bullish and relatively strong, the continuous rise away from the 5-day moving average in the past three days does not dare to follow the bullish highs. You can wait patiently for a wave of corrections to appear, and when the 5-day moving average is touched or pierced through the 5-day, but after the 10-day support, you can continue to have the courage to rise all the way north;
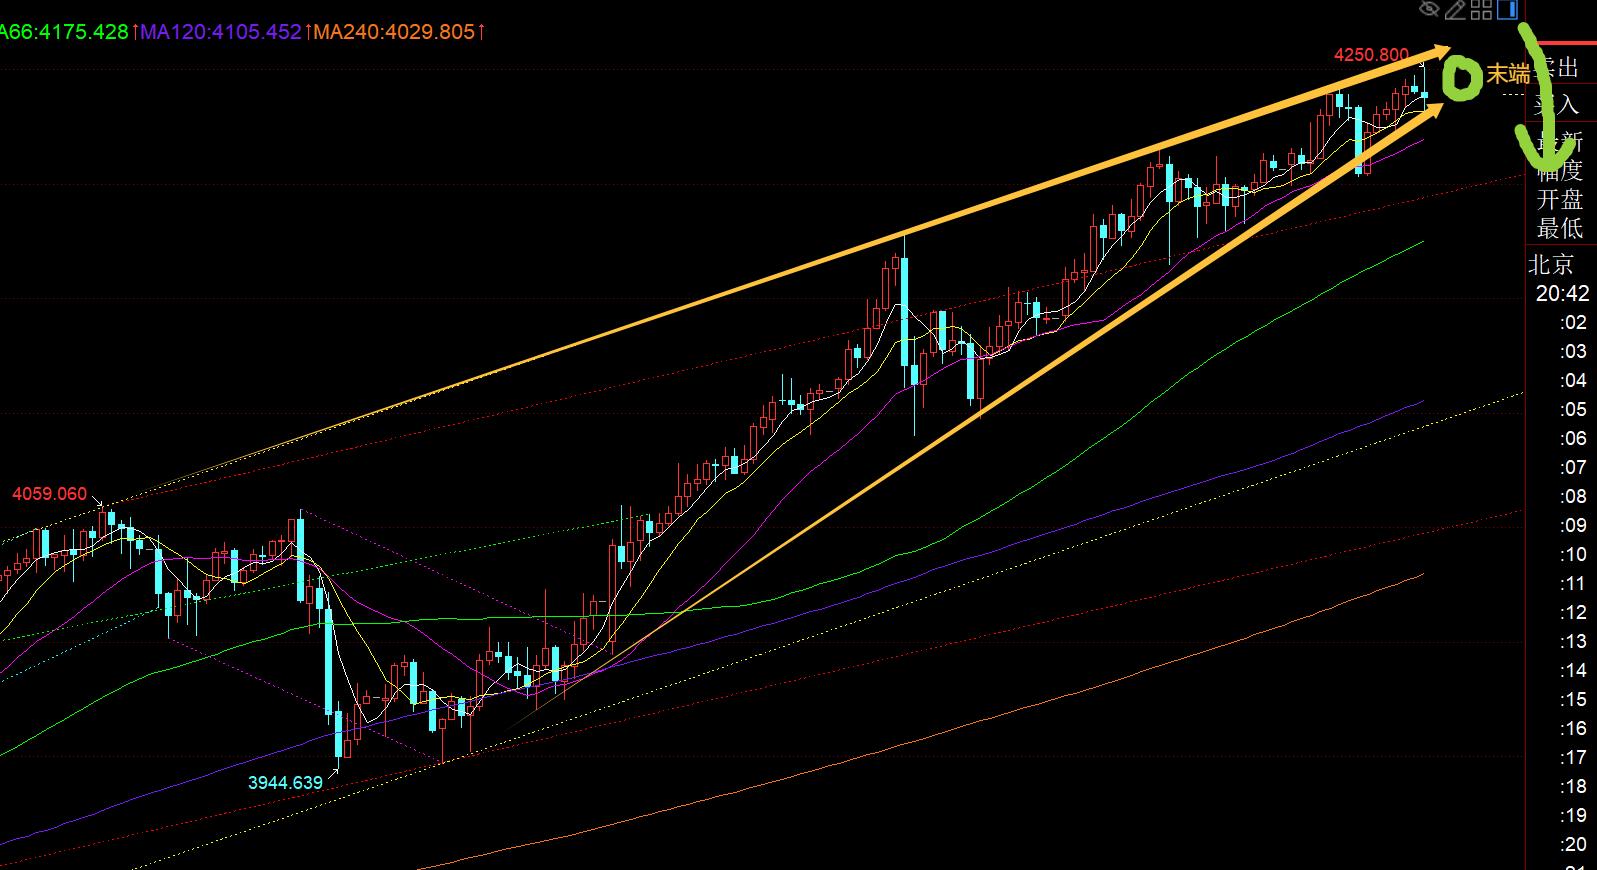
Second, the golden hourly level: it closed at a relatively high level overnight, and continued to rise in a cycle this morning. The upper track of the channel in the chart was under pressure in the afternoon at 4242, and fell sharply. This trend resistance line was still under pressure in the European market yesterday at 4218. That line, and then closed at 14 o'clock with a full strong Yin, reaching the 4210 target; since it was a strong Yin, it did not have a long lower shadow K, so after a rebound to confirm that the 5 EMA was suppressed by 4230-34, you can try to suppress the downward trend, but unfortunately only 4222 was given. Pan Lianyang bottomed out and pulled up, hitting a new all-time high; however, we have to be cautious tonight. On the one hand, the 4255 line is the counter-pressure point of the channel, and on the other hand, it moves towards the end of the ascending convergence triangle, leaving little room for it to run, and the market may change at any time; therefore, the support is still The middle track is 4220. Only if it effectively breaks below and falls below it, will there be a slightly greater probability of short-term adjustment. The resistance is 4255. If there is a high below it, try to be cautious and blindly chase the rise. Look at the gains and losses of the two positions, and wait for the signal;
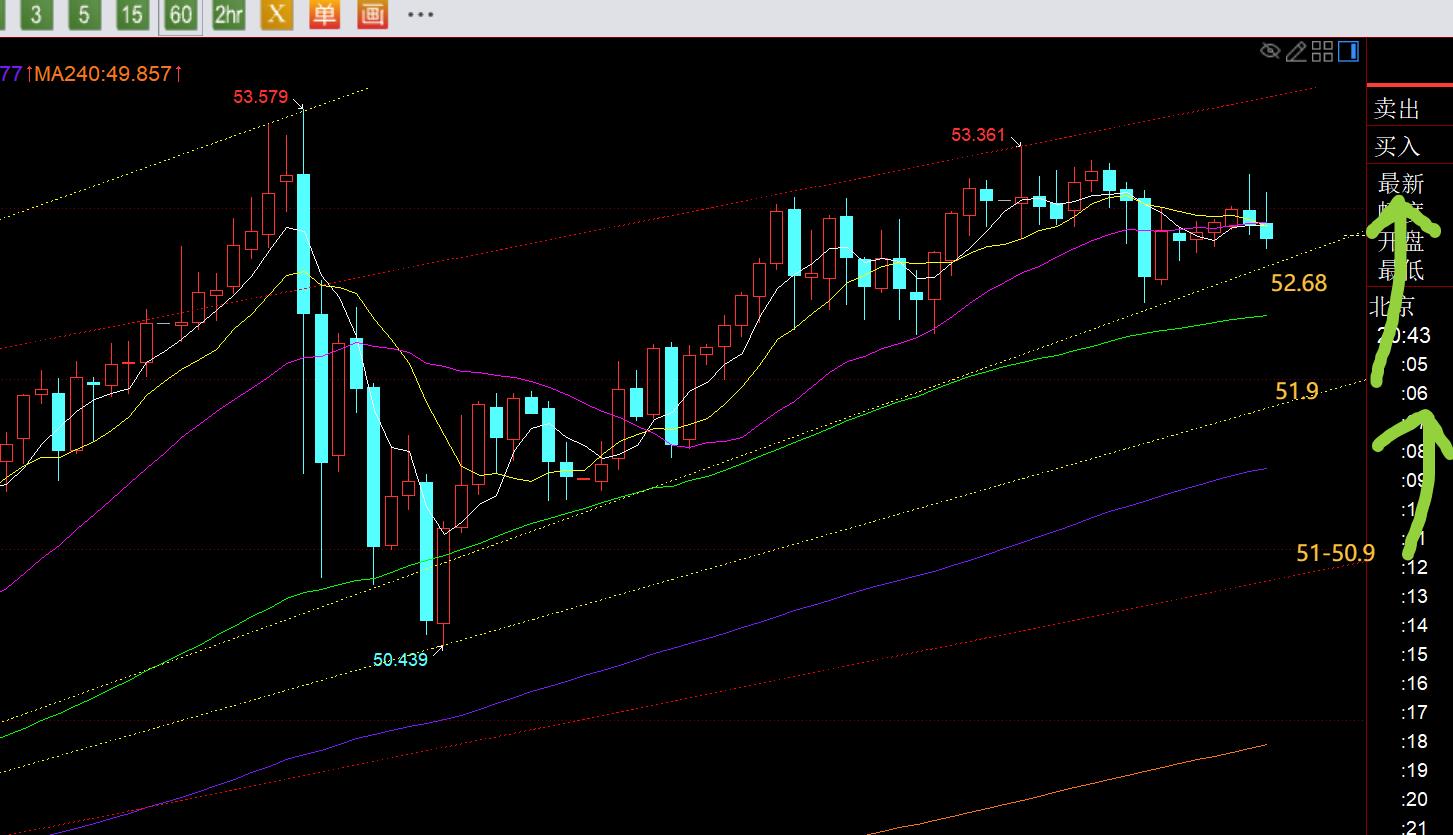
Silver: The daily 5-day moving average supports 51.9. The price during the day is still at a certain height, and it is not suitable to chase the rise. The resistance is 53.4-53.6, and the support is 52.68. Once it falls, it may even fall below the European market. At a low of 52.45, it will first be lowered to 51.9 before demand stabilizes, with strong support at 51-50.9 before stabilizing and rising;
The above are several views of the author's technical analysis, as a reference, and also daily trends over the past twelve years. A summary of the technical experience accumulated from more than 12 hours of watching and reviewing the market, technical points will be disclosed every day, and www.xmmen.combined with text and video interpretation, friends who want to learn can www.xmmen.compare and reference based on the actual trend; those who agree with the idea can refer to the operation, take good defense, and risk control first; those who do not agree, just ignore it; thank you for your support and attention;
[The opinions of the article are for reference only, investment is risky, you need to be cautious when entering the market, operate rationally, strictly set losses, and control positions. Risk control www.xmmen.comes first, and you are responsible for profits and losses]
Writer: Zheng Shi Dian Yin
Reading and researching the market for more than 12 hours a day, insisting on it for ten years, making detailed technical interpretations public to the entire network, serving with sincerity, dedication, sincerity, perseverance, and wholehearted service to the end! Write www.xmmen.comments on major financial websites! Proficient in K-line rules, channel rules, time rules, moving average rules, segmentation rules, top-bottom rules; student cooperation registration hotline - WeChat: zdf2899849 86
The above content is all about "[XM Foreign Exchange Market Analysis]: Gold's Rising Convergence Triangle has entered its end, beware of taking profits again at 4255". It was carefully www.xmmen.compiled and edited by the XM Foreign Exchange editor. I hope it will be helpful to your trading! Thanks for the support!
After doing something, there will always be experiences and lessons learned. In order to facilitate future work, the experience and lessons from previous work must be analyzed, researched, summarized, concentrated, and improvedCome to understand it from a theoretical level.
Disclaimers: XM Group only provides execution services and access permissions for online trading platforms, and allows individuals to view and/or use the website or the content provided on the website, but has no intention of making any changes or extensions, nor will it change or extend its services and access permissions. All access and usage permissions will be subject to the following terms and conditions: (i) Terms and conditions; (ii) Risk warning; And (iii) a complete disclaimer. Please note that all information provided on the website is for general informational purposes only. In addition, the content of all XM online trading platforms does not constitute, and cannot be used for any unauthorized financial market trading invitations and/or invitations. Financial market transactions pose significant risks to your investment capital.
All materials published on online trading platforms are only intended for educational/informational purposes and do not include or should be considered for financial, investment tax, or trading related consulting and advice, or transaction price records, or any financial product or non invitation related trading offers or invitations.
All content provided by XM and third-party suppliers on this website, including opinions, news, research, analysis, prices, other information, and third-party website links, remains unchanged and is provided as general market commentary rather than investment advice. All materials published on online trading platforms are only for educational/informational purposes and do not include or should be considered as applicable to financial, investment tax, or trading related advice and recommendations, or transaction price records, or any financial product or non invitation related financial offers or invitations. Please ensure that you have read and fully understood the information on XM's non independent investment research tips and risk warnings. For more details, please click here